Setup your Radar
Build a privacy-first traffic radar; 1x Pi, no cameras, no cloud, just local speed data and PDF reports
A weatherproof traffic logger that keeps data local, requires no cameras, and helps you make a data-informed case for safer streets.
Difficulty: Intermediate • Time: 2–4 hours • Cost: $650
On this page
Introduction #
Safer streets start with measured traffic speeds.
One afternoon, a Raspberry Pi, and a radar sensor. By the evening you will have a speed monitor logging every vehicle that passes, a live dashboard, and the beginnings of the local dataset you will carry to your next council meeting. No cameras, no licence plates, no cloud accounts: just local speed data on hardware you own.
Before you begin #
You need two devices for setup: a computer to flash the SD card, and a Raspberry Pi to run the radar service. The Pi is the sensor host. The computer is only for setup.
You also need a legal place to deploy the sensor: your own property, permission from a property owner, or a portable roof-rack mount.
Tools needed:
- Computer with Raspberry Pi Imager installed
- 5/16" nut driver (steel bands)
- Screwdriver
- Handsaw or circular saw
- Drill and bits
- Pencil and tape measure
- Optional: mitre box for 45° cuts
- Optional: multimeter
- Smartphone or tablet camera (for the protractor step)
No soldering required · No coding required · No prior radar experience needed
Privacy considerations #
What this system collects #
| ✅ Collected | Vehicle speed, direction, timestamp (traffic volume is derived from detections) |
| ❌ Not collectable | By design: no camera, no licence-plate reader, no GPS. The system cannot collect vehicle identity, driver identity, or information about residents or passers-by. velocity.report itself does not collect operator identity. |
| ❌ Not transmitted | The software does not upload sensor data to velocity.report or any other central service. Optional remote-access services may have their own account or identity requirements. |
| ❌ No telemetry | No analytics, no tracking pixels, no telemetry. The software does not phone home with your measurements. |
These are not policy choices that could change in a future version. The radar hardware has no camera input, and the software has no built-in path that uploads your measurements to a central service. The velocity.report project has no analytics pipeline and no mechanism to receive data from deployed devices. Your data is yours.
Compliance #
Measuring vehicle speeds on public streets is generally legal when the sensor is on property where you have permission to install equipment. Mounting on public utility poles requires explicit permission. Always check your local regulations.
What you will build #
- Doppler radar logger: captures vehicle speeds 24/7
- Local SQLite database: all data stays on the device
- Live web dashboard: real-time speeds, histograms, time-of-day patterns
- Professional PDF reports: traffic engineering metrics (p50, p85, p98)
- Weatherproof hardware: designed for permanent outdoor deployment
The velocity.report Pi image includes everything pre-configured: flash one SD card, connect one sensor, and it starts collecting.
Parts list #
| Part | Price | Notes |
|---|---|---|
| Radar sensor OPS7243-A-CW-R2 | $420 | IP67, 100 m range, RS232 |
| Sensor mounting bracket OPS100-BK | $50 | Metal bracket for OPS7243 enclosure |
| Sensor cable OPS700-CBL-M1-PT-1.8 | $17 | M12 to pigtail; connects sensor to serial HAT |
| Raspberry Pi 4 (2 GB) | $55 | Also compatible with Pi 5 |
| Waveshare PoE HAT (F) | $20 | Powers the Pi + sensor over Ethernet |
| Waveshare RS232 HAT | $16 | RS232 interface for the sensor |
| Adafruit DE-9 serial connector | $3 | Connects sensor cable to serial HAT |
| SanDisk High Endurance 32 GB | $23 | High-endurance; designed for continuous writes |
| Core total | $604 | |
| ABS pipe, 4-in × 2-ft | $25 | Sensor mast |
| Timber stud, 2×4 × 8-ft | $4 | Crossbar and upright |
| Hose clamps ×2 | $6 | Clamp crossbar to roof rack bars |
| Corner braces, 4-pack | $5 | Brace the T-frame |
| Deck screws, 67-pack | $6 | Frame assembly |
| Full total | $650 | Core + roof rack mount |
Power is delivered over Ethernet via the PoE HAT. You will need a PoE-capable switch or injector on the network side. For mobile deployment you will also need a PoE battery pack or 12 V car outlet adapter, and a short Ethernet cable.
Step-by-step build guide #
Build overview (total time: 2–4 hours)
- Wire the Sensor to the Raspberry Pi: 15–30 minutes
- Flash the Pi Image: 10–15 minutes
- Access the Web Dashboard: 5 minutes
- Mount the Radar Sensor: 1–2 hours
- Configure Your Site: 10 minutes
- Generate Reports: after data collection
Step 1: wire the sensor to the Raspberry Pi #
Estimated time: 15–30 minutes
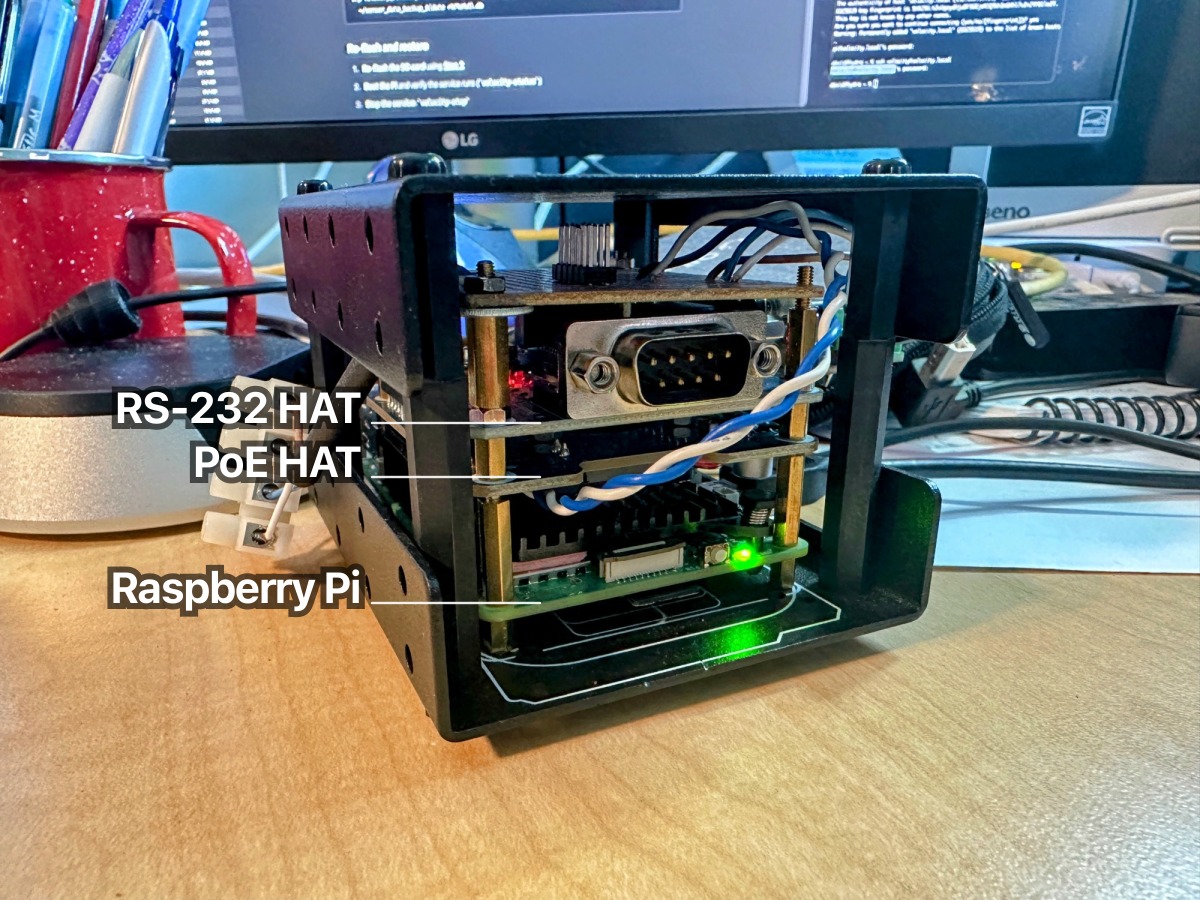
The OPS7243-A-CW-R2 sensor connects to the Raspberry Pi via an RS232 serial HAT. The PoE HAT stacks on top to provide power over Ethernet.
If hardware setup is new to you, go slowly: this step is connector assembly only. No soldering is required.
-
Attach the PoE HAT to the Raspberry Pi’s 40-pin GPIO header
-
Stack the serial HAT (Waveshare RS232/485) on top of the PoE HAT. Ensure all pins are aligned and fully seated.
-
Wire the sensor to the HAT following the wiring diagram below:

Step 2: flash the Pi image #
Estimated time: 10–15 minutes
The velocity.report image is a complete Raspberry Pi OS with everything pre-installed and pre-configured; flash it to an SD card and the system is ready to run.
Option A: use the custom Raspberry Pi Imager catalogue (recommended) #
This opens Raspberry Pi Imager with the velocity.report image pre-loaded:
macOS
cd "/Applications/Raspberry Pi Imager.app/Contents/MacOS/" && \
  ./rpi-imager --repo https://velocity.report/rpi.json
Linux
rpi-imager --repo https://velocity.report/rpi.jsonWindows
"C:\Program Files (x86)\Raspberry Pi Imager\rpi-imager.exe" --repo https://velocity.report/rpi.json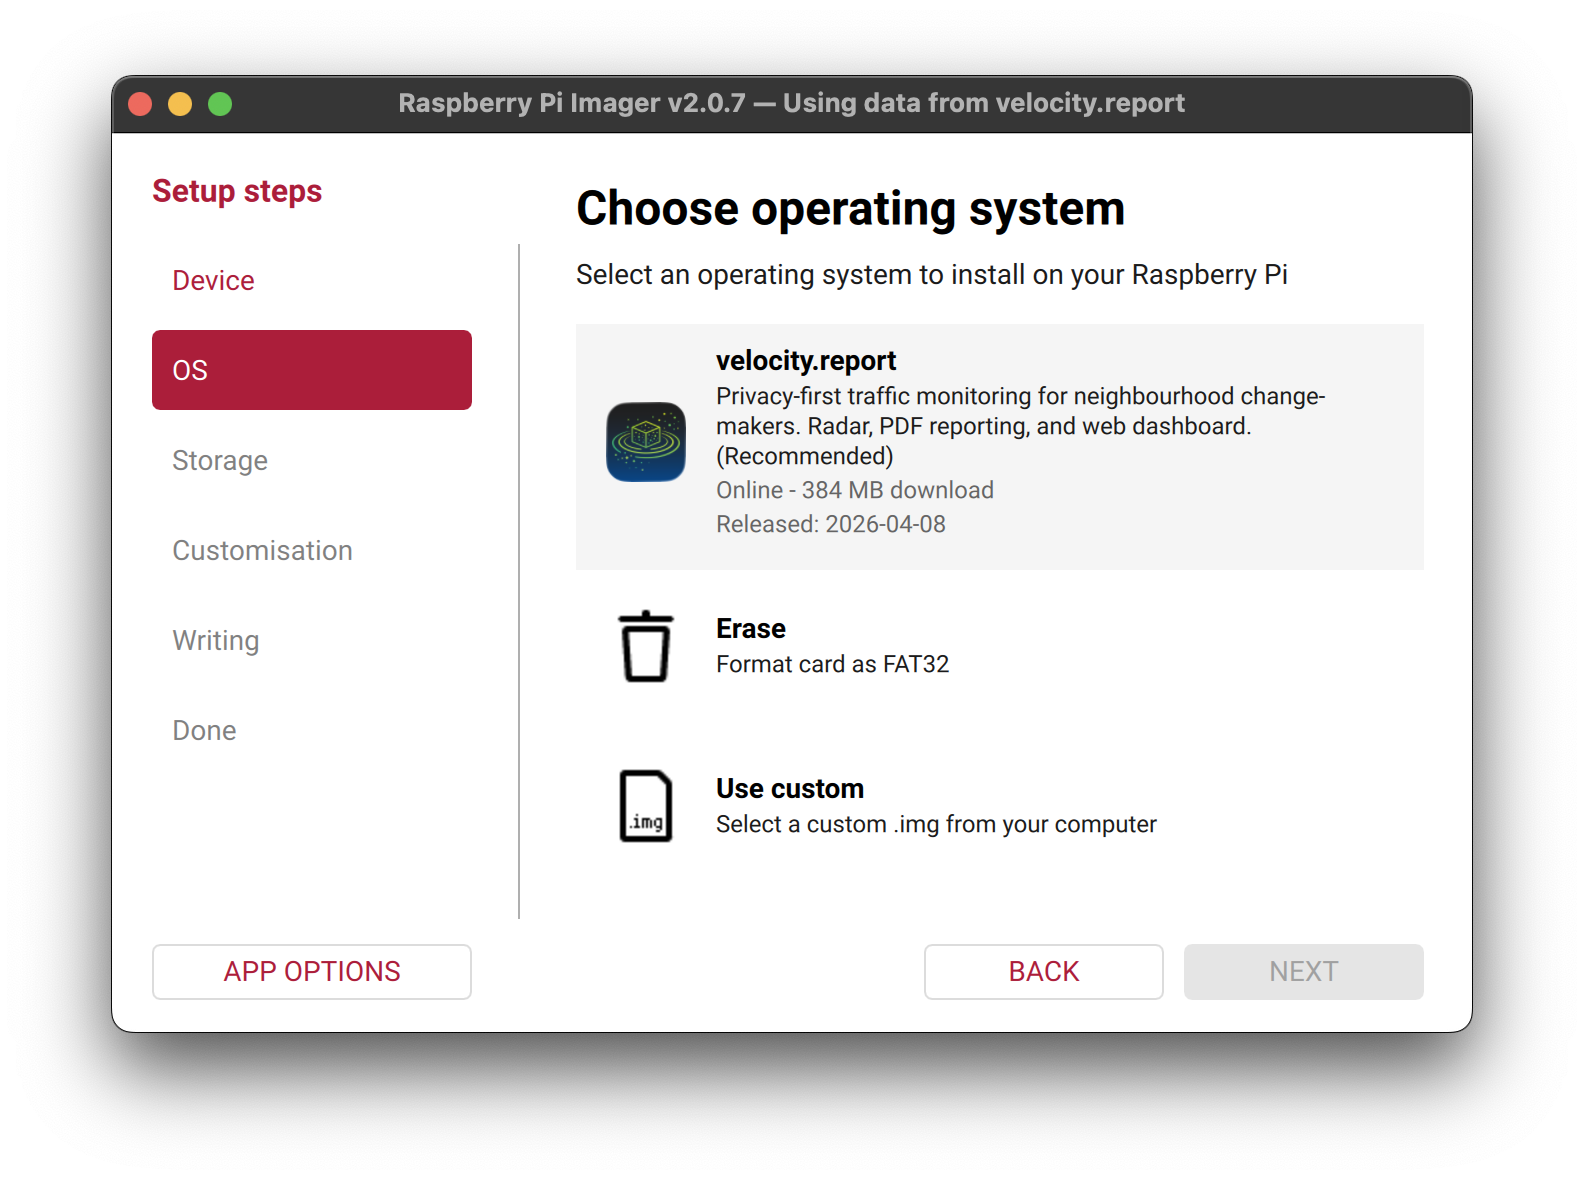
-
Select your Pi model
-
Select velocity.report from the OS list
-
Choose your SD card (32 GB high-endurance recommended)
-
Configure settings before writing: click the gear icon (⚙) or Edit Settings; set the hostname to
velocity(or your preference); enable SSH with Allow public-key authentication only if possible, or use password authentication with a strong password if you do not yet have a key; keep the username aspifor now and set a strong password; and configure Wi-Fi only if you need wireless access as a fallback or for initial setup without Ethernet. -
Write the image
Option B: manual download #
- Download the latest
.img.xzfile from GitHub Releases - Open Raspberry Pi Imager, select Choose OS → Use custom, and select the file
- Configure settings as above, then write
After flashing #
- Insert the SD card into your Raspberry Pi and connect the PoE Ethernet cable
- Wait 1–2 minutes for first boot, then connect:
ssh pi@velocity.localThe service starts automatically on boot and configures the sensor (JSON mode, units, magnitude). Verify it is running:
velocity-statusTo watch live logs:
velocity-logThe image installs shell aliases for common operations: velocity-status, velocity-log, velocity-bounce (restart), velocity-stop, and velocity-start. See the Reference section for the full list.
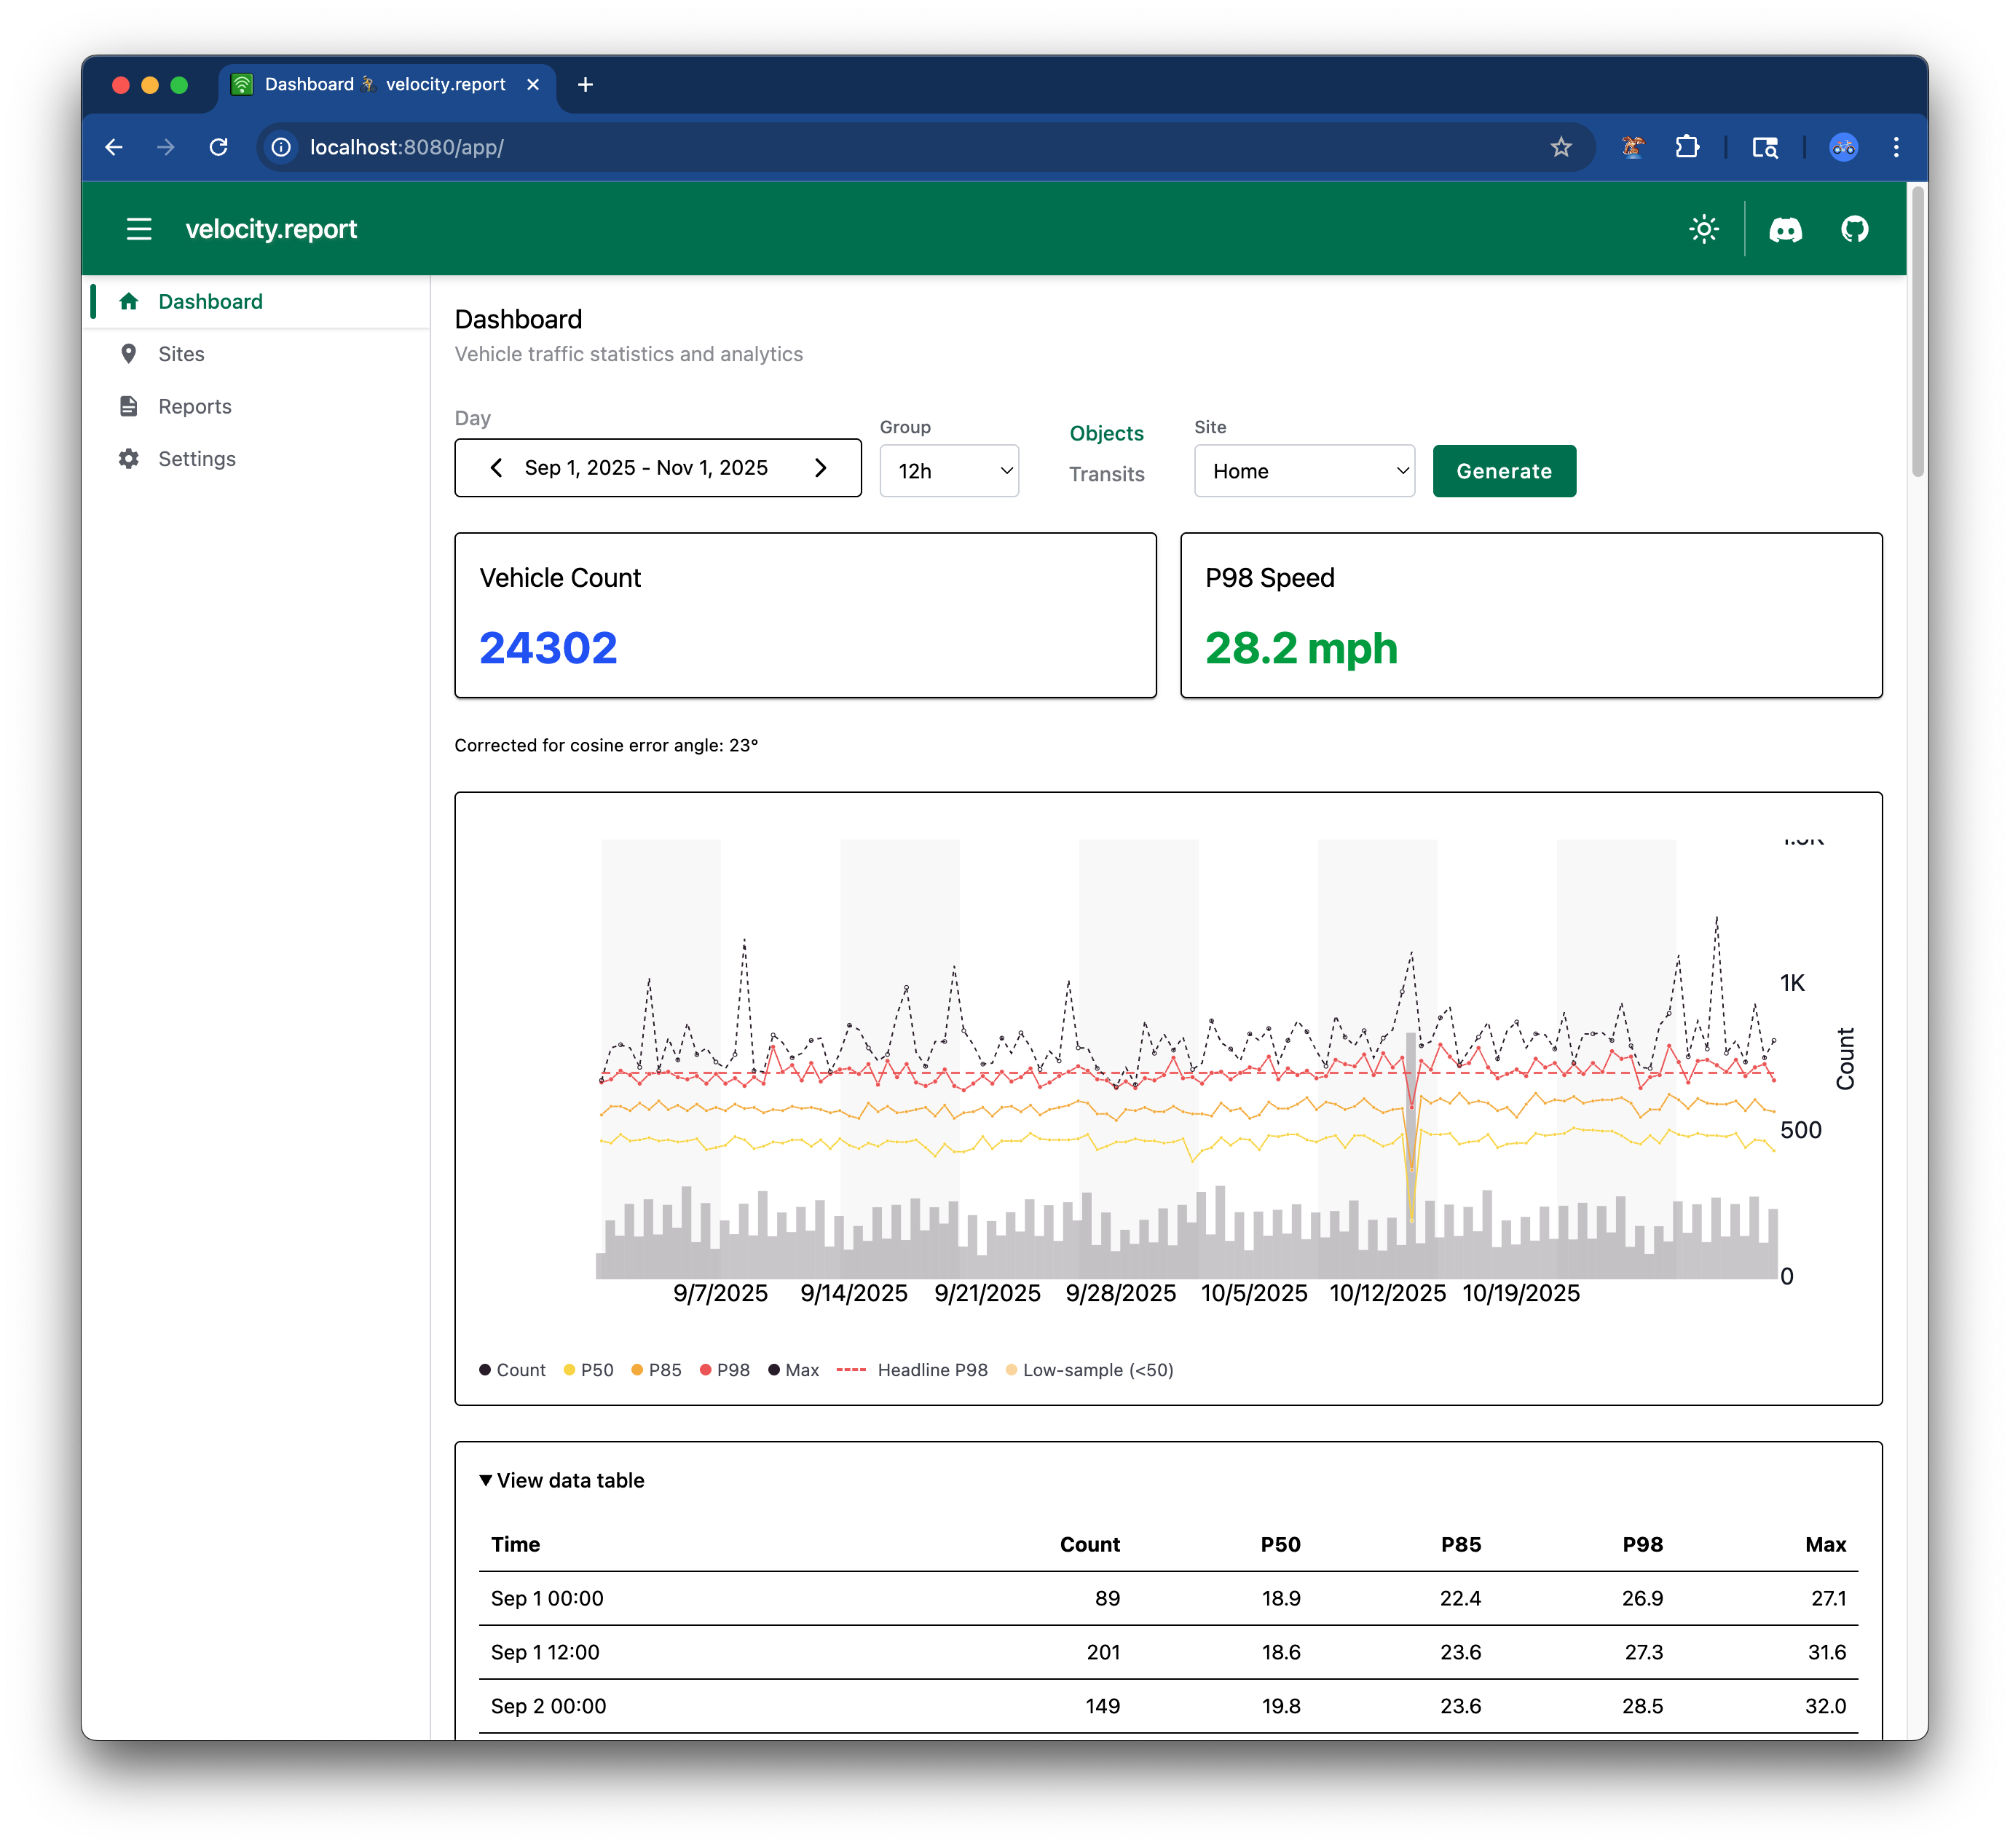
Step 3: access the web dashboard #
Estimated time: 5 minutes
Open a browser on any device on the same network: http://velocity.local
The dashboard is served over plain HTTP on your local network: no port number, no certificate to install, and no browser warning to click through. The device serves only aggregate speed data and no personal information, so it ships HTTP-only on the LAN by design. If you want a trusted HTTPS padlock — for example to reach the device securely from outside your home — that is a Tailscale opt-in, covered in Remote access with Tailscale below.
Success criteria: the dashboard loads and shows live vehicle detections or “No data yet”
If the dashboard will not load:
- Check the service is running:
velocity-status - Find the Pi’s IP address:
hostname -I - Test from the Pi itself:
curl http://localhost/ - Check logs:
velocity-log
Step 4: mount the radar sensor #
Estimated time: 1–2 hours
The same hardware supports two deployment modes: a portable rig on your car roof rack, or a fixed mount at home. Pick whichever suits the situation, or build both and move the sensor to whichever street needs attention this month.
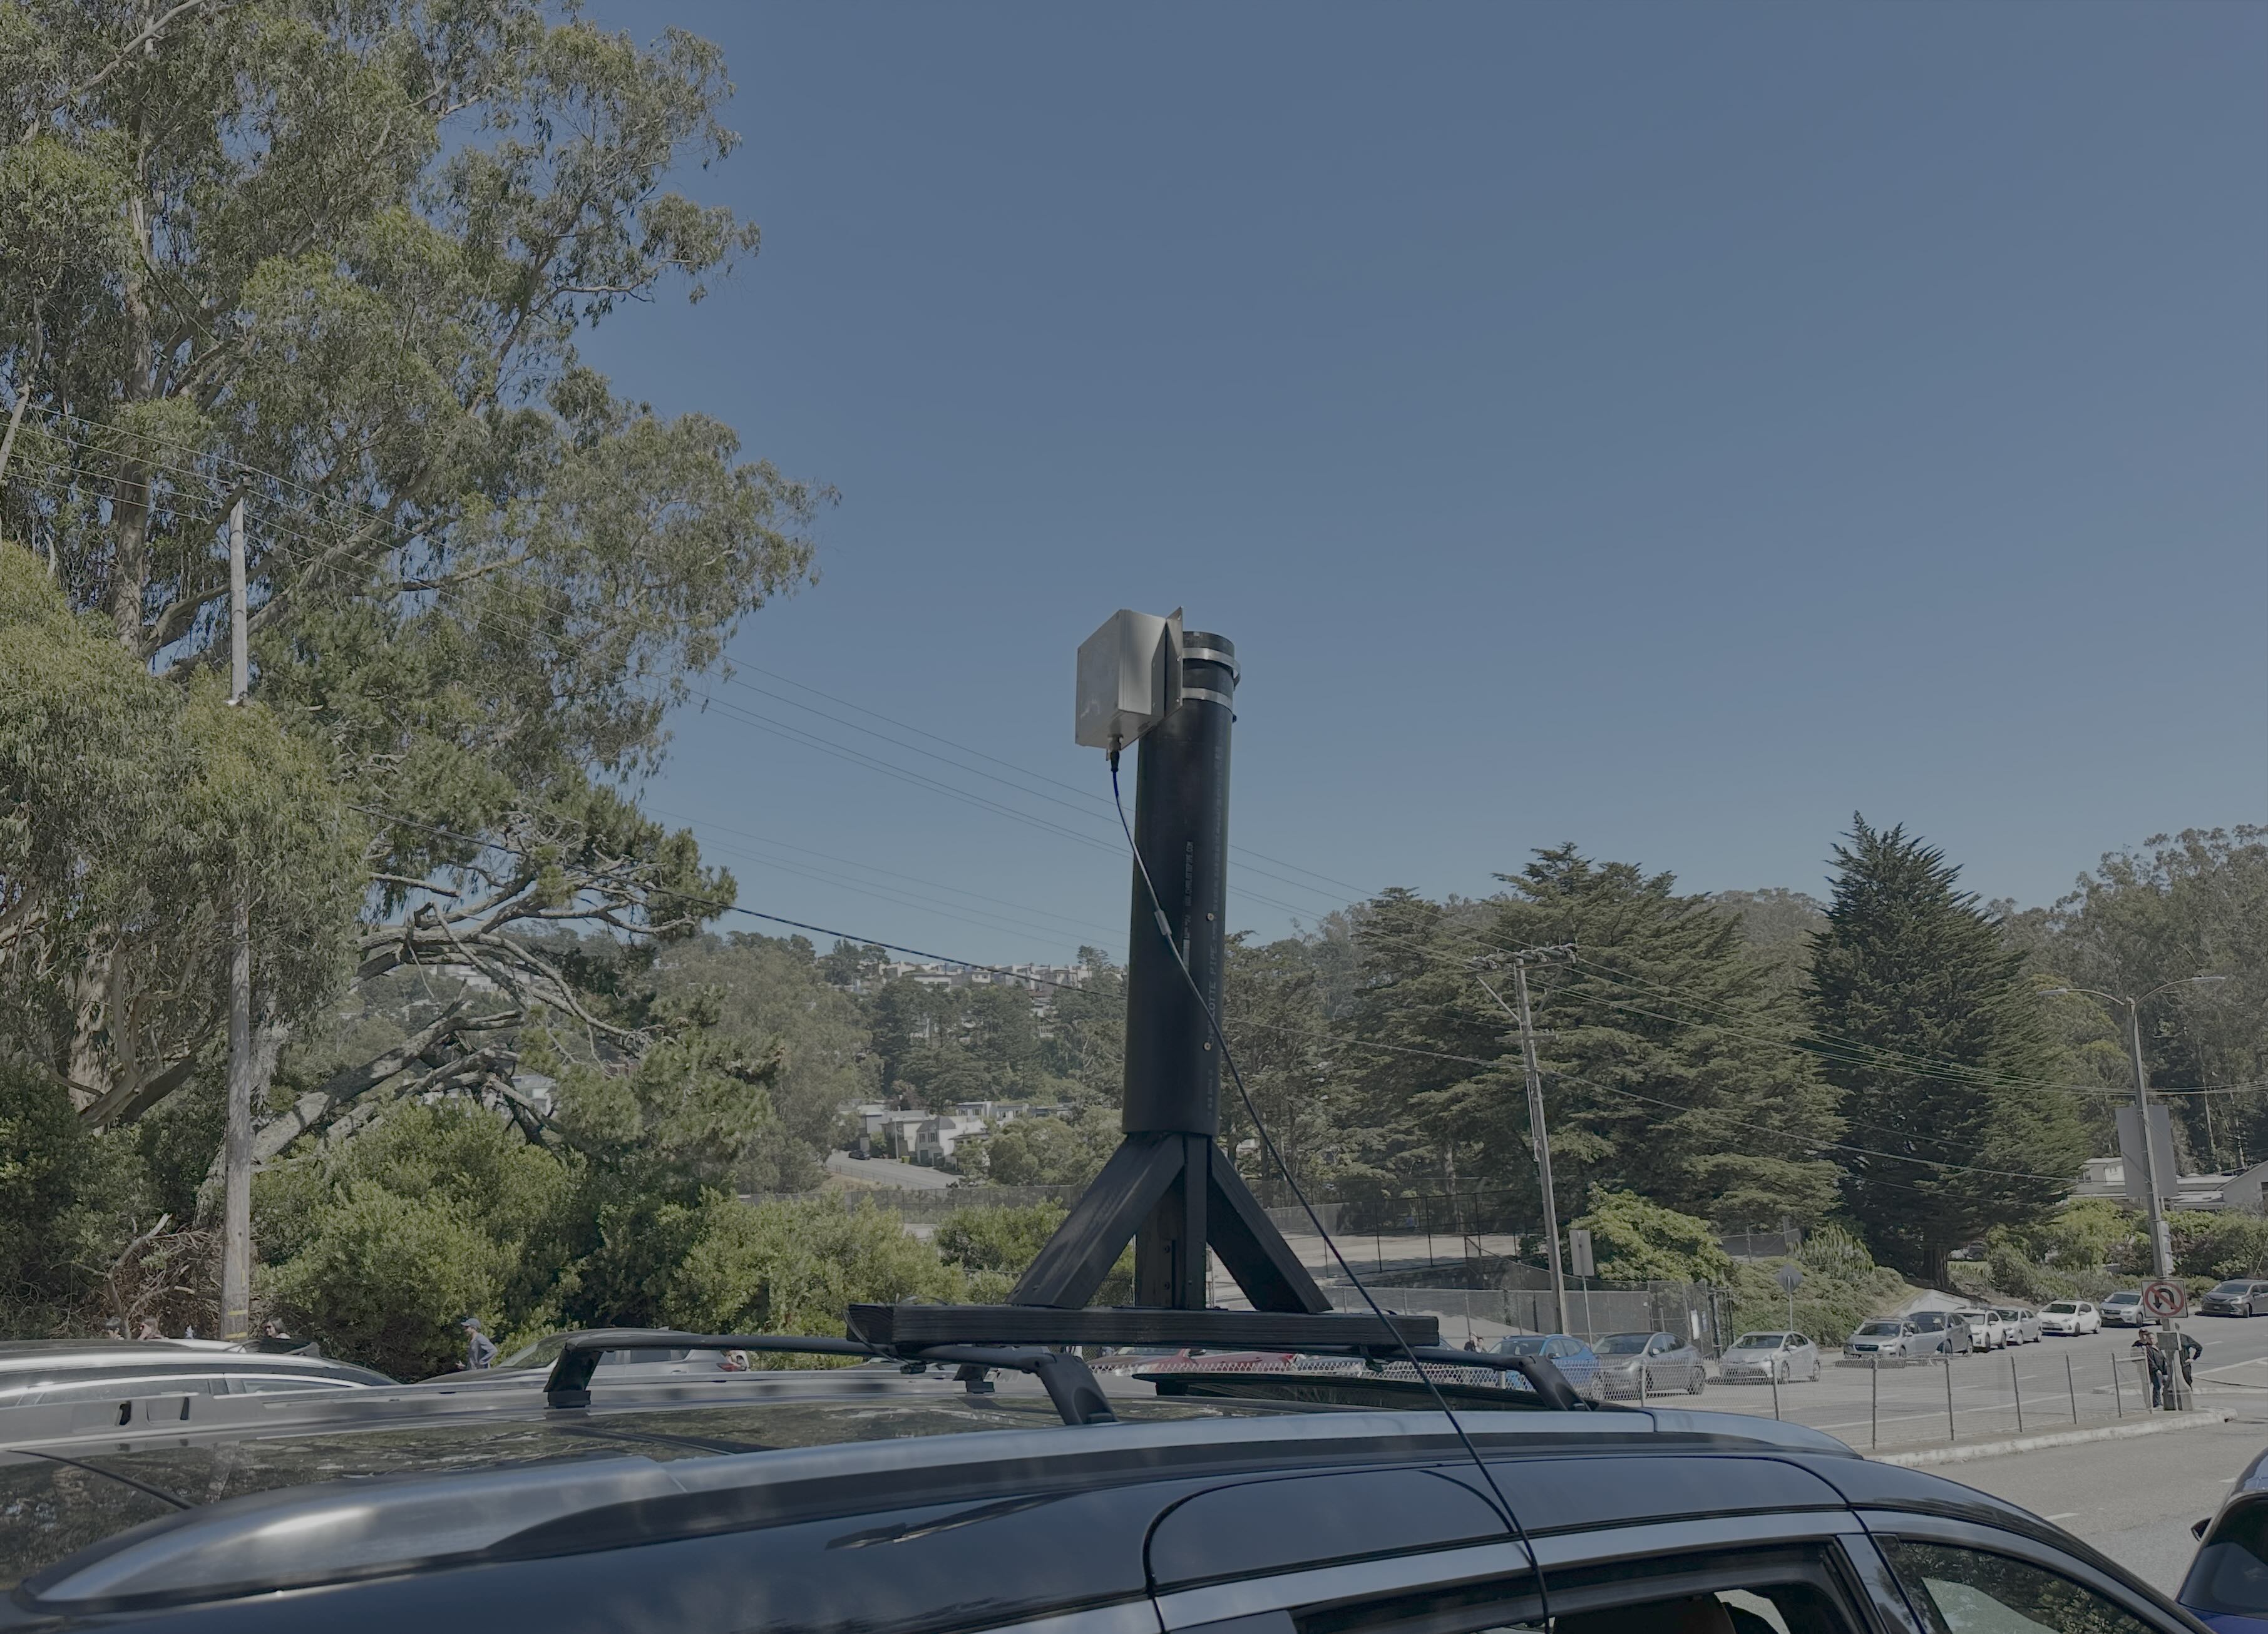
Deployment option A: car roof rack mount (mobile) #
A portable rig that clamps to a standard roof rack. Park on any street, collect data for a few hours or a few days, then drive to the next location. One sensor, many streets.
Parts are listed in the parts list above. You will also need a PoE battery pack or 12 V car outlet adapter, and a short Ethernet cable from sensor to Pi.
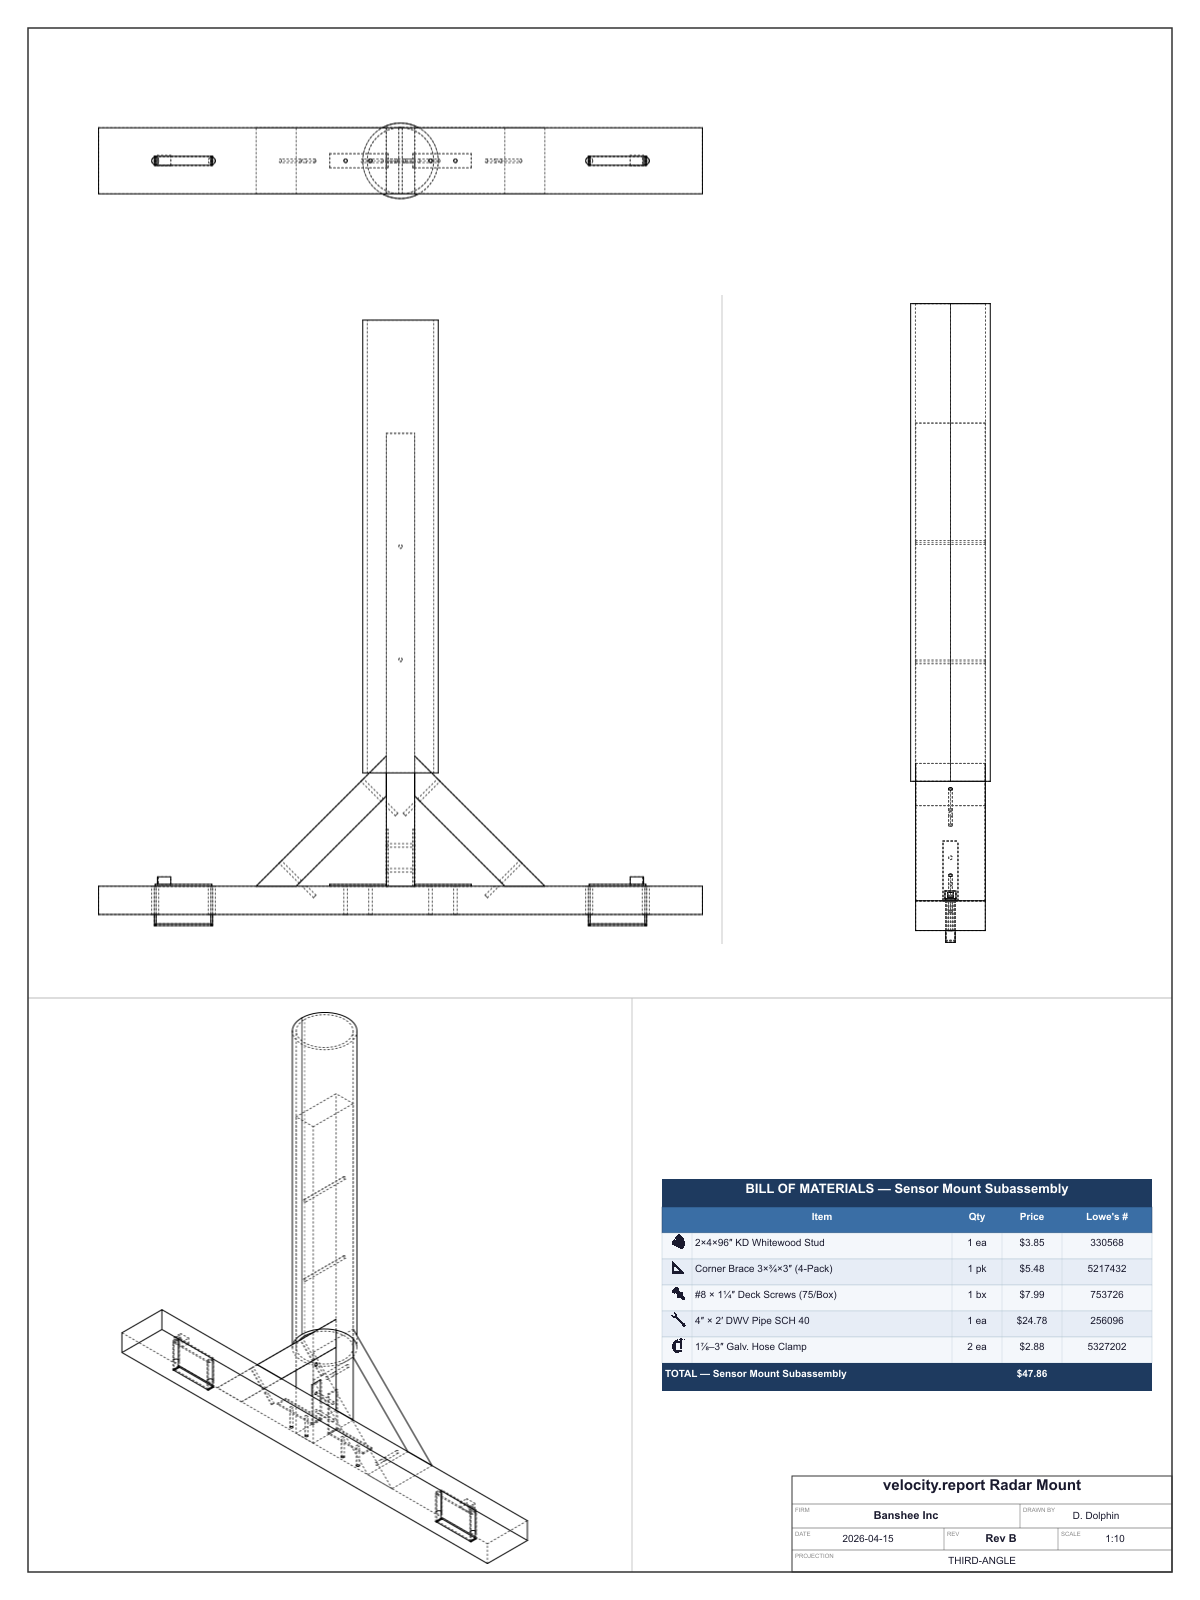
Building the roof rack mount
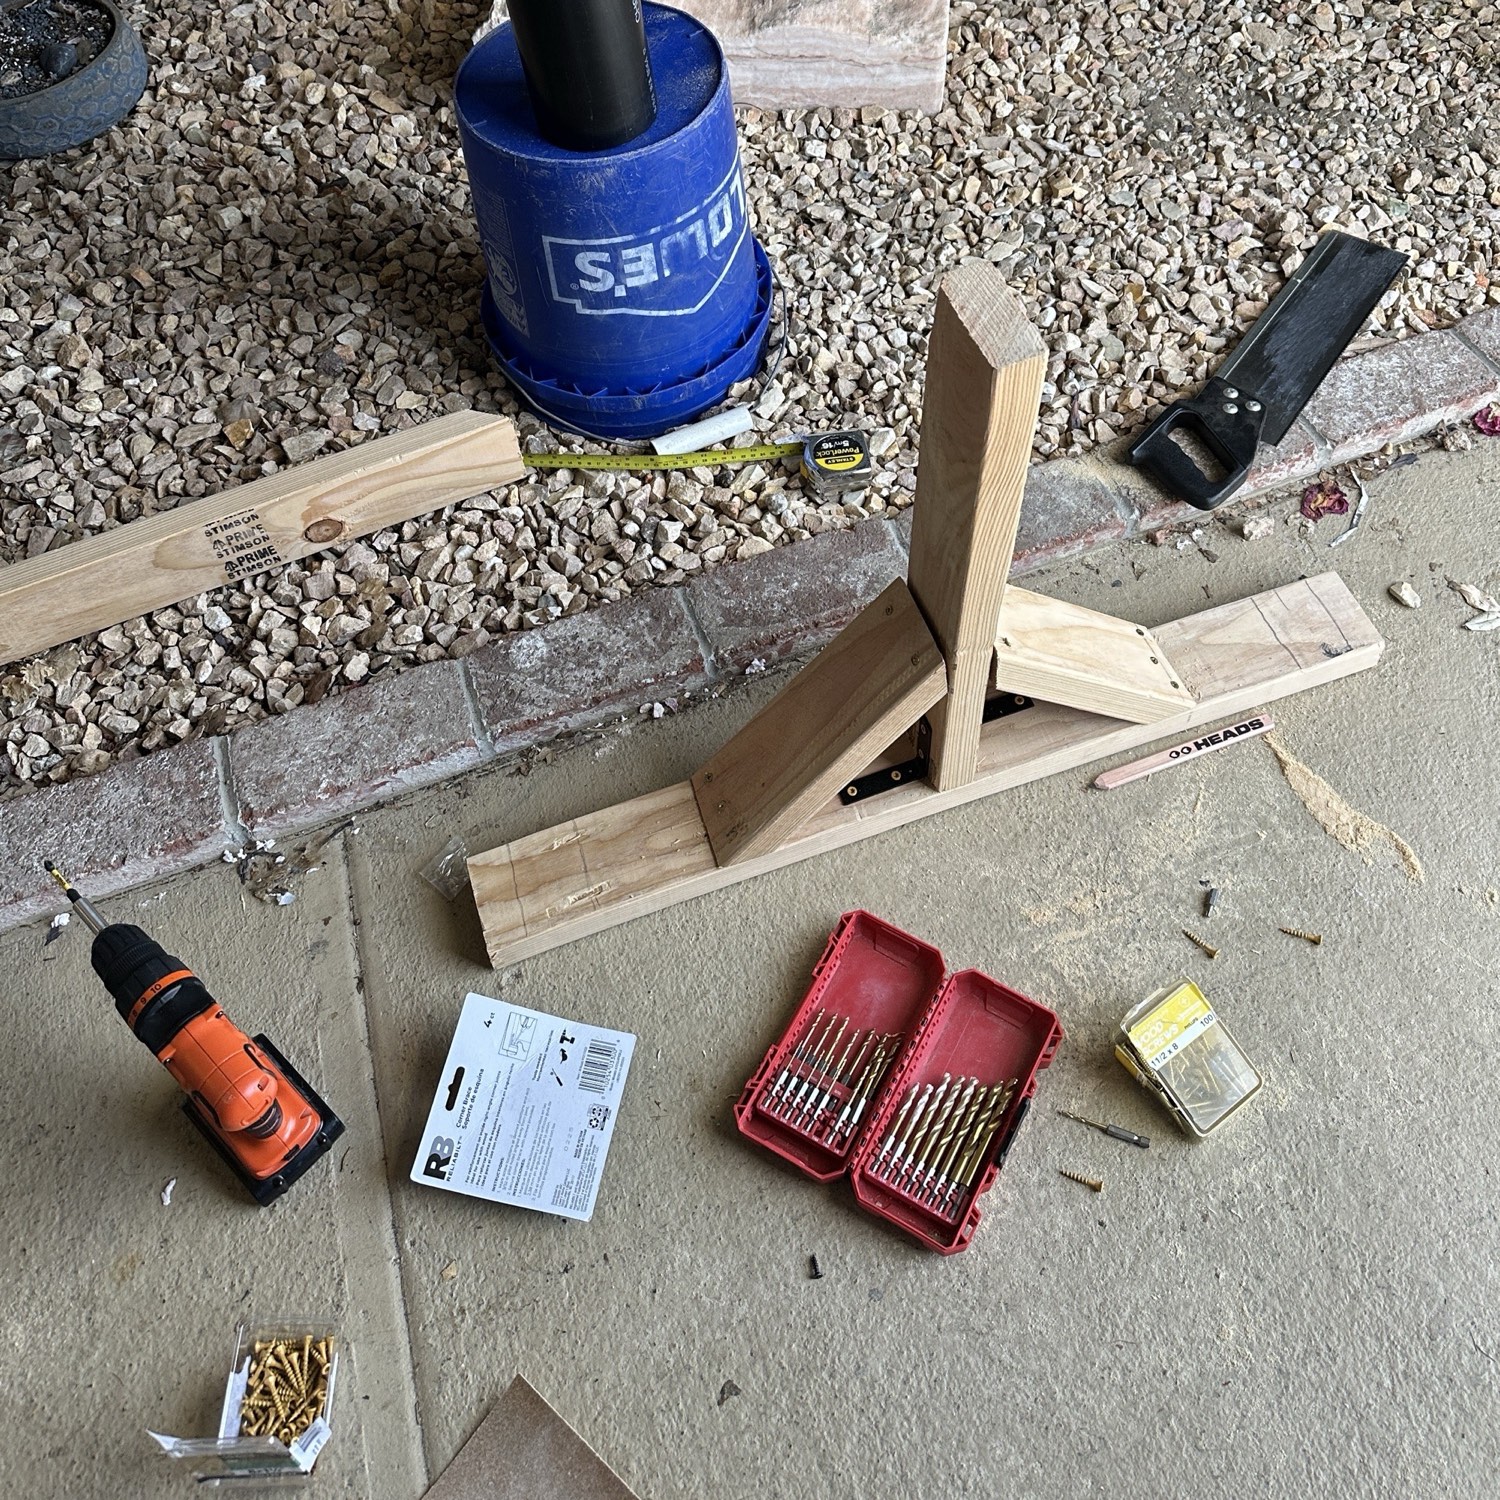
-
Cut the 2×4 into four pieces: one 32-inch crossbar, one 24-inch upright, and two 11-inch braces (top-edge measurement, 45° mitres at both ends).
-
Build the main T-joint first: centre the upright on the crossbar and fasten it with corner brackets and deck screws so it stands properly vertical.
-
Fit the two 45° braces, one each side, and fasten with the remaining brackets and deck screws. These braces are what keep the structure from developing opinions in the wind.
-
Mark two pipe fixing points where it overlaps the wooden upright: 6-inch and 12-inch up from the bottom of the pipe. Drill pilot holes through the pipe into the wood.
-
Attach the pipe to the upright: hold the pipe vertical against the upright and drive screws through the pilot holes into the wood until the mast is locked in place.
-
Measure roof-rack bar spacing centre-to-centre, then mark and drill matching clamp holes in the crossbar.
-
Attach the sensor to the pipe. Use hose clamps to secure the sensor body to the pipe. Tighten evenly.
-
Clamp the crossbar to the roof rack. Use the two 1-13/16 to 3 in galvanised clamps and tighten firmly so the mount stays stable in wind while parked.
-
Route the cable from the sensor through a rear window seal or sunroof into the car. Connect to the Pi and power source inside.
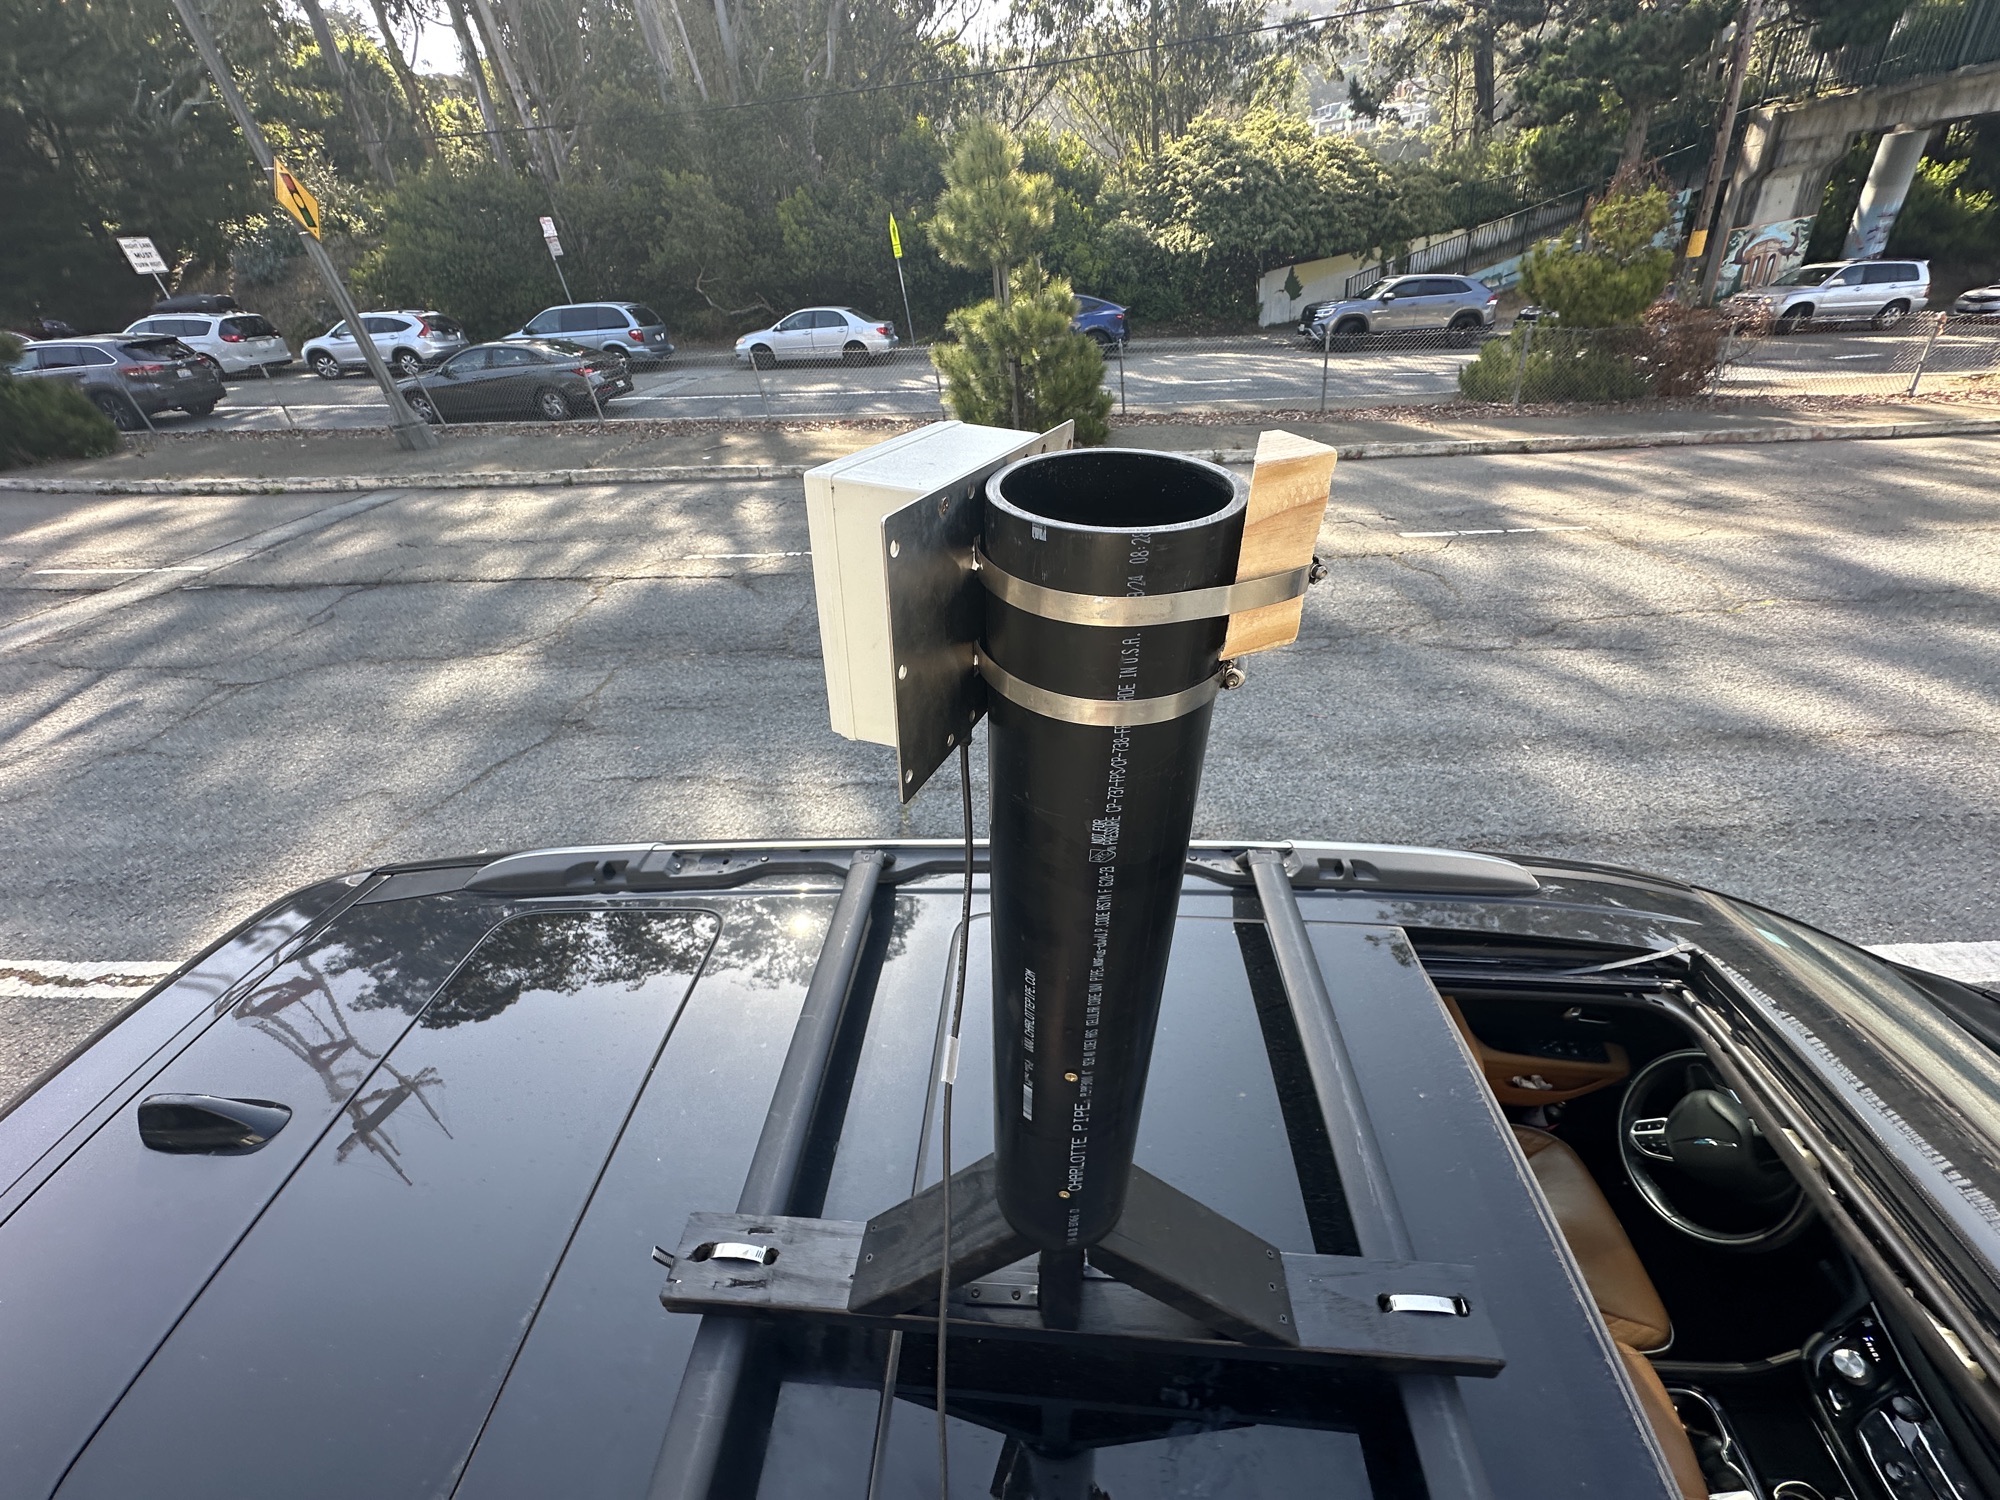
Do not drive with the mount attached!
Deployment option B: home installation (permanent) #
A permanent mount on your property, aimed at the street.
Positioning:
- Mount 4–8 feet off the ground (reduces false detections from small objects)
- Use two stainless steel hose clamps (top and bottom)
- Choose a location with a clear line of sight to traffic
Weatherproofing checklist:
- ✅ Enclosure gasket intact and clean
- ✅ Seal tested before final mounting
- ✅ All cable glands sealed
Success criteria: enclosure is weatherproof, sensor aims correctly, mounting is secure
Aiming the sensor #
Once the sensor is mounted, aim it before collecting data. These guidelines apply to both deployments. For the mobile mount, parking parallel to the kerb already puts you close to 0°.
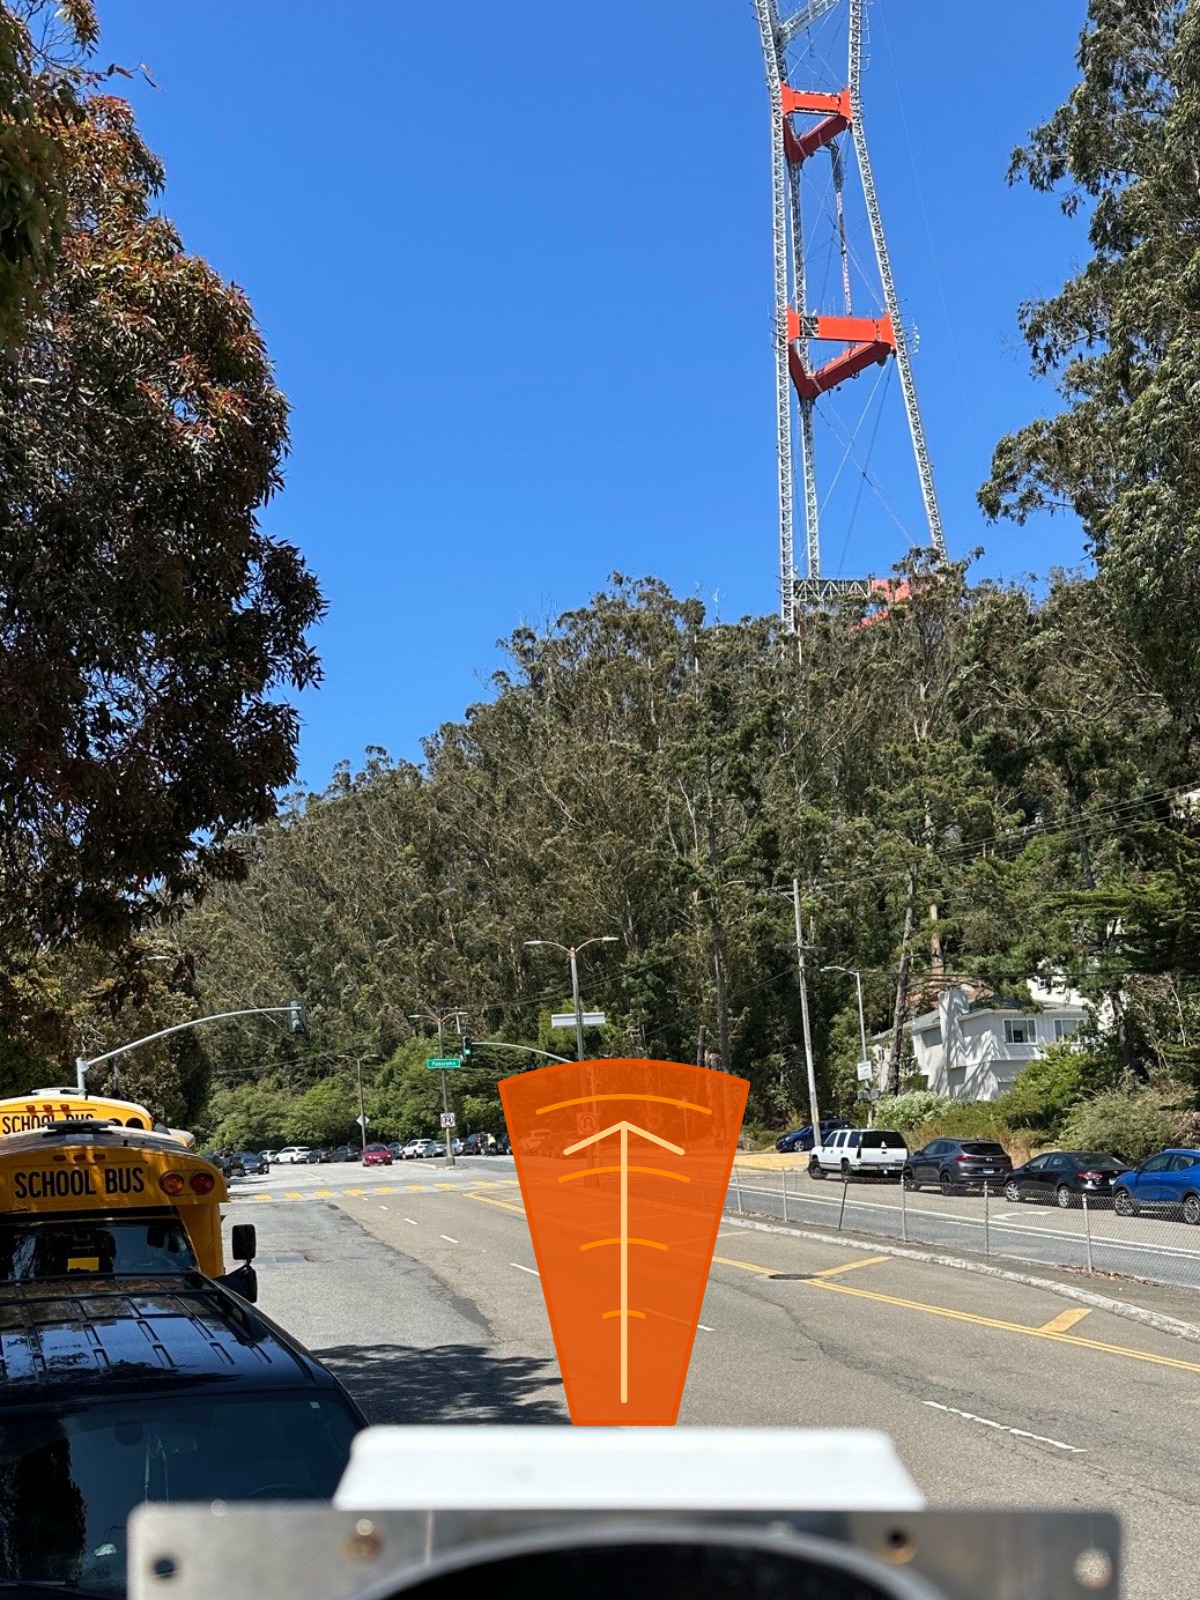
- Angle: as close to 0° (parallel with traffic flow) as practical. Aim for less than 30° when the street allows. Lower angles need less cosine correction, so the speed readings are more accurate.
- Road coverage: the beam must encompass the full lane of traffic you are measuring. In many streets, keeping the sensor under 30° still widens the field-of-view triangle enough to capture vehicles across the lane while keeping cosine error modest. Choose the smallest angle whose beam triangle fully covers the lane.
- Orientation: face approaching or receding traffic (not perpendicular)
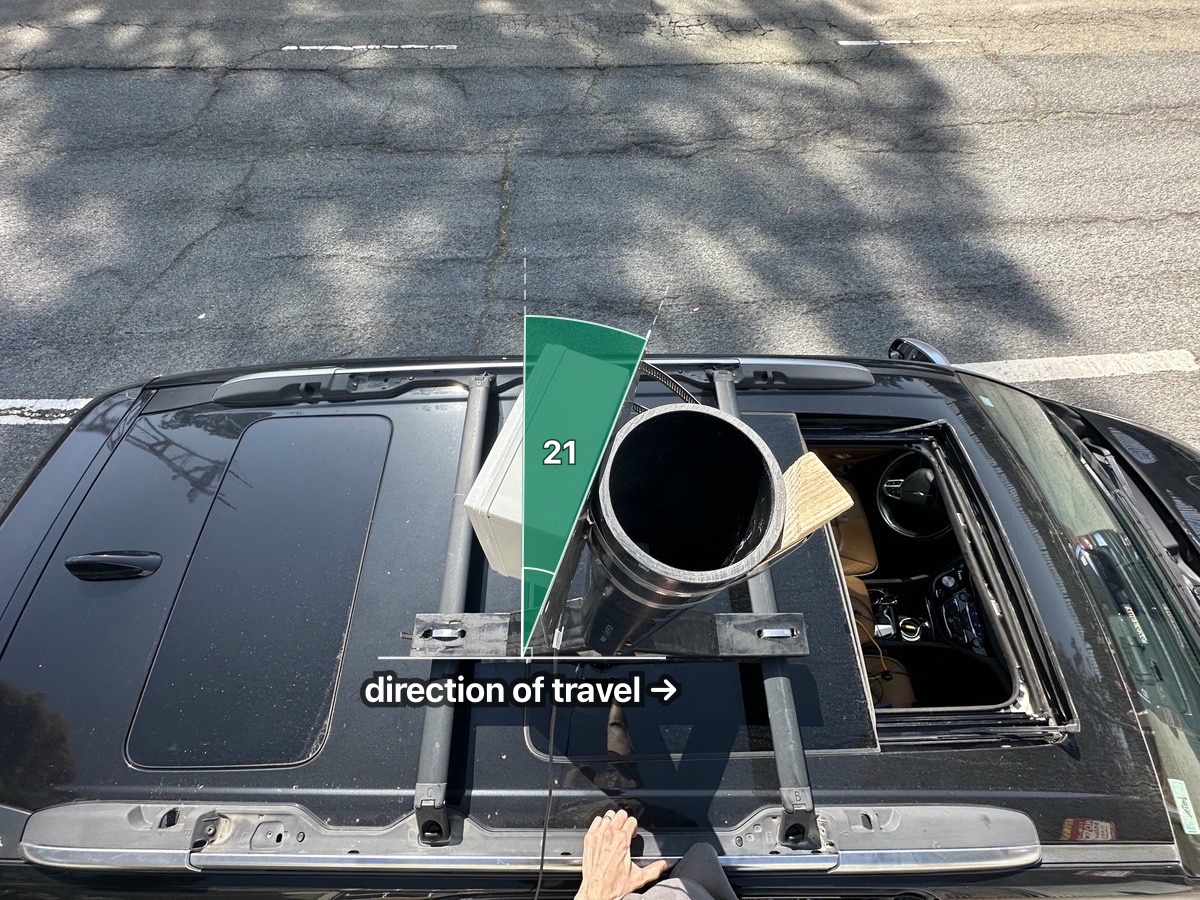
Recording your mounting angle
You will enter this in the dashboard as the cosine error angle (Step 5). Use the protractor to measure it from a photo.
- Take a photo looking straight down at the road surface, perpendicular to the kerb. Include the sensor and the road in the frame.
- Draw one line along the kerb and a second line from the sensor along its beam direction.
- Measure the angle from the kerb's 90° upright to the sensor beam. The protractor derives this cosine error angle directly.
Step 5: configure your site #
Estimated time: 10 minutes
Before generating reports, configure your site in the dashboard so speed measurements are corrected for your mounting angle.
- Open the dashboard at http://velocity.local
- Navigate to Site Settings
- Set the site location on the interactive map. The map is optional; see Your address in reports in Step 6 before deciding how much location detail to include.
- Set the cosine error angle to match your radar mounting angle from Step 4. Drag the red dot on the radar field-of-view triangle to adjust the angle visually, or type the value directly. The triangle should encompass the road lanes you want to measure.
- Add any notes about the installation (useful for later reference)
- Save the configuration
The system stores this as the active site configuration period. Reports use the angle automatically to correct measured speeds. If you change the mounting angle later, create a new configuration period so historical reports remain accurate.
Step 6: generate reports #
After collecting data for a few days, generate professional reports from the dashboard.
- Open the dashboard at http://velocity.local
- Select your site and set the date range for the report period
- Click Generate Report
- Download the PDF
The report uses the cosine error angle from your site configuration (Step 5) to correct measured speeds automatically.
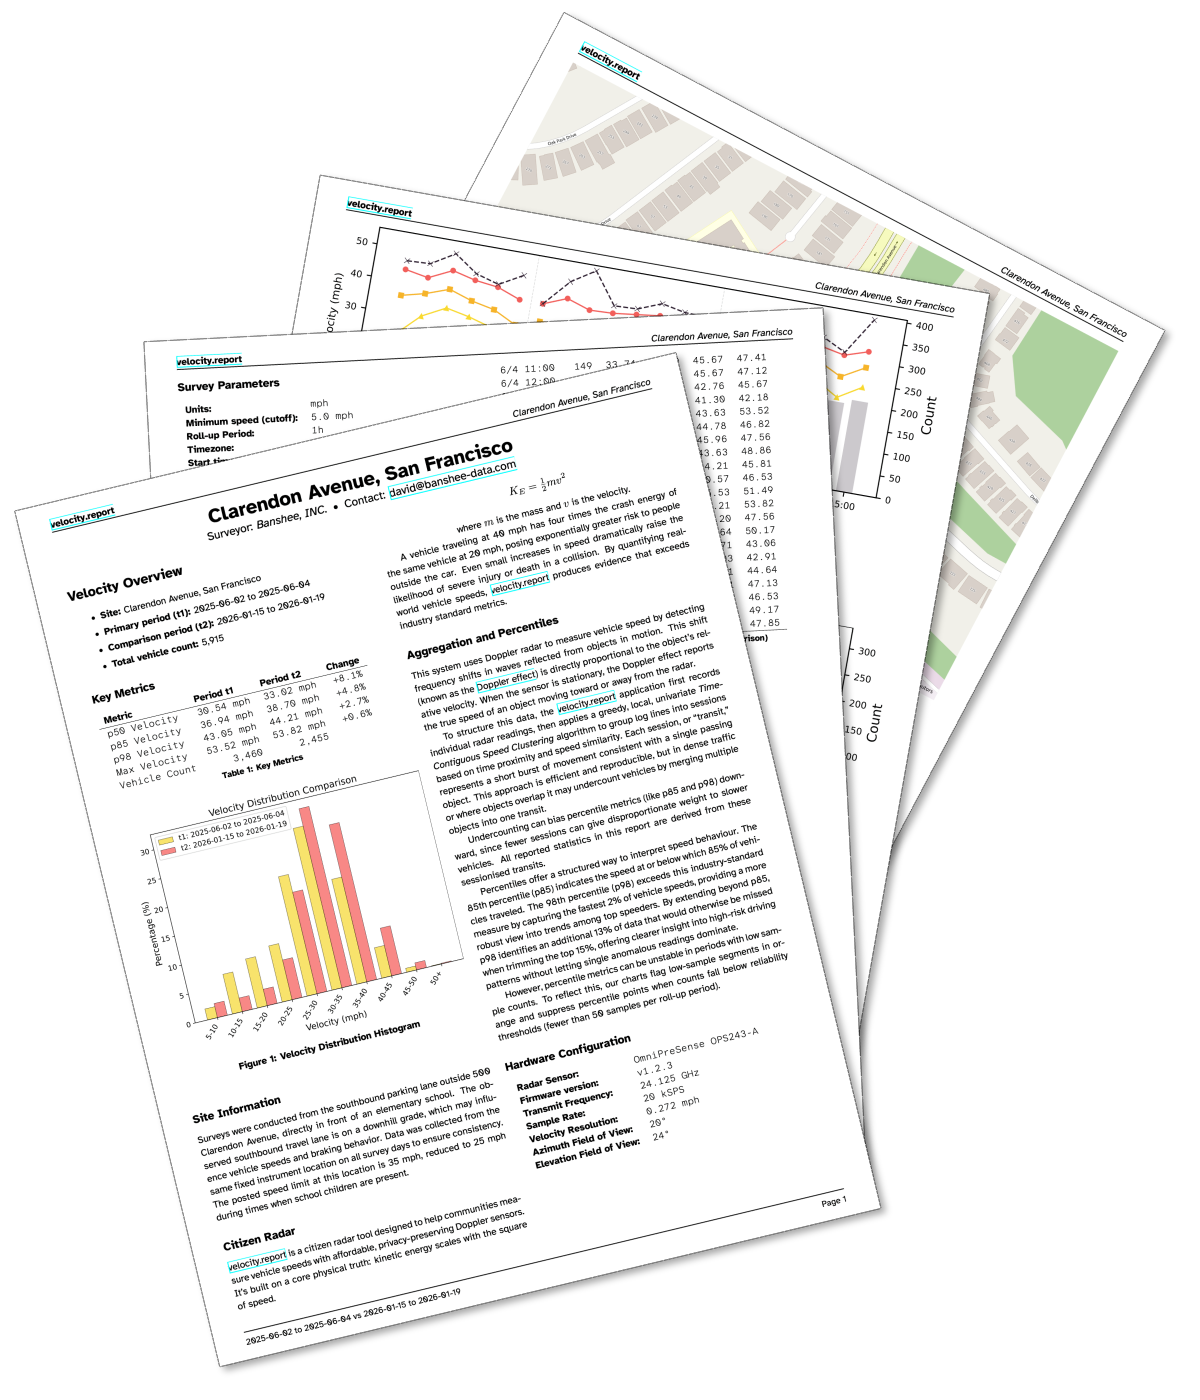
What the report includes:
- p50 (median): half of vehicles go faster than this
- p85 (traffic engineering standard): speed at which 85% of traffic travels at or below
- p98 (top 2%): threshold where the fastest regular drivers operate
- Speed distribution histograms and time-of-day charts
The dashboard also supports comparison reports for measuring the effect of traffic calming interventions: select two date ranges and the report shows side-by-side metrics with percentage changes.
Your address in reports #
The site name is a free-text field and the map is entirely optional. The report does not require a precise location to be useful; a council officer reading a p85 speed figure does not need to know which house it came from.
Reports are often entered into the public record, published on council websites, and shared in community groups. Think about how much location detail you are comfortable with before including a map.
| Detail level | Example | Who can be identified |
|---|---|---|
| Neighbourhood | “Capitol Hill” | Nobody |
| ZIP / postcode | “98102” | Nobody |
| Span of blocks | “200–400 block of Elm St” | Nobody easily |
| Nearest cross-street | “Elm St at Oak Ave” | Narrows to one intersection |
| Street name only | “Elm Street” | Caution: on a short residential street, this can narrow down the source to a handful of households |
For most presentations to council, a neighbourhood name or ZIP code is sufficient context. The traffic data is what carries the argument, not the pin on the map.
If you are not comfortable sharing your location, leave the map out entirely. A report without a map is better than a report with a misleading or deliberately wrong location. Do not include false data: it undermines your credibility and the integrity of the record.
Take your data to City Hall #
Print the report. Bring it to the meeting. The data does the persuading.
The report contains speed measurements only: no vehicle identities, no personal information about residents or passers-by. You are presenting measured traffic patterns, not surveillance data. The PDF is generated locally on your Pi and goes nowhere until you decide to share it: there is no upload, no submission, no copy sent to velocity.report.
Whether you are at a city council session, a town board hearing, or submitting written comments to a transport committee, the approach is the same: state the measured speed, and explain what it means.
Measure before. Measure after. The numbers tell you whether the changes worked.
What to bring #
- Printed PDF report: a physical document can be held, marked up, and filed into the public record. Screen shares cannot.
- Site photos: the street, the school, the park, the crossing. Data tells the story; photos make it concrete.
- Before-and-after comparison: if the council has already approved changes, bring the comparison report. Did p85 drop? Did it stay down?
What to say #
Lead with the metric traffic engineers already use:
“The 85th-percentile speed on [street name] is [X] mph. The posted limit is [Y] mph.”
The p85 is the standard threshold in US federal speed surveys and UK Department for Transport assessments. Using it means your data speaks the same language as a professional traffic study.
Then adapt to the situation:
- If the intervention worked: “After the [speed hump / signage / enforcement], p85 dropped from [X] to [Y] mph.”
- If it worked and then wore off: “p85 dropped initially. [N] months later it has returned to [W] mph.”
- If nothing has changed: “We have [N] weeks of continuous data. The p85 is [X] mph, consistently [Z] mph above the posted limit. This is the normal condition of this street.”

In January 2026, a velocity.report user took 6,000 transits from Clarendon Avenue (a 25 mph school zone on San Francisco’s high-injury network) to the SFMTA board. After repaving, median speed was up 8% to 33 mph and p85 up 5% to 39 mph. The ask: publish a before-and-after scoreboard for every project, and keep iterating until the speeds actually drop.
That is the standard to keep in view: fewer crashes, fewer injuries, and zero fatalities. If the speeds do not drop, the work does not stop.
What to suggest #
Present the problem first, then name what might help:
- Speed humps or raised crossings: reduce p85 by 5–15 mph in most studies
- Kerb extensions: narrow the crossing distance
- Chicanes or lane narrowing: remove the straight-line path
- 20 mph zones: lower posted limits near schools and parks
- Radar speed signs: real-time driver feedback
- Targeted enforcement: your time-of-day data shows peak hours
You do not need to prescribe the answer. Present the evidence, name the options, and ask what the council can commit to and when.
Keep measuring #
Attend regularly. Each presentation enters the public record. Share the report with neighbours, the local press, and your elected representative.
- Baseline before any intervention
- Initial effect in the first weeks after a change
- Long-term compliance in the months that follow
- Regression: whether speeds drift back once the novelty wears off
A week of data shows patterns. A month is compelling. Three months across seasons is the kind of evidence that holds up in a budget discussion. The community that keeps measuring is the one that gets heard.
Network access and security #
Local network (recommended) #
The dashboard runs on plain HTTP (port 80) and is reachable from devices on the same network at http://velocity.local — no port number and no certificate to install. Unless you configure port forwarding or another remote-access path, the dashboard stays on your local network. For a browser-trusted HTTPS padlock, add Tailscale (see below).
Best practices:
- Use SSH key authentication (configured during flashing)
- Use a strong Wi-Fi password (WPA3 if supported) if Wi-Fi is enabled
- Keep the OS updated:
sudo apt update && sudo apt upgrade - velocity.report does not upload telemetry or sensor data. Optional tools such as updates and Tailscale use the network only when you choose to use them.
Remote access with Tailscale (optional) #
Tailscale is an optional tool for operators who need private reachability from outside their home network without opening a port on the router. It is useful for SSH, administration, and putting the Pi on a private mesh network. The primary browser path documented in this guide is still the local dashboard at http://velocity.local.
# Install Tailscale on your Pi
curl -fsSL https://tailscale.com/install.sh | sh

# Start Tailscale and authenticate
sudo tailscale up
Follow the authentication URL, install Tailscale on your phone or laptop, then use the Tailscale network for SSH and private device access.
Want an HTTPS padlock? Tailscale can also put a browser-trusted HTTPS certificate in front of the dashboard — no warnings, nothing to install on each device. After tailscale up, run one more command:
# Serve the local dashboard over HTTPS on your tailnet
sudo tailscale serve --bg http://localhost:80
sudo tailscale serve status   # prints the https://<host>.<tailnet>.ts.net URL
Open the printed *.ts.net URL from any device on your tailnet. See the Tailscale documentation for details.
Shared and untrusted networks #
If the Pi is connected to a shared network (school, workplace, library, or multi-tenant building), other devices on that network can reach the dashboard. The dashboard has no user authentication: anyone who can reach port 80 can view the speed and traffic volume data.
This is not a privacy risk to vehicles or residents: the dashboard shows only aggregate speed metrics, not identities or personal information. If you do not want other network users viewing your traffic measurements, isolate the device using one of the options below.
Recommended isolation:
- VLAN: place the Pi on a dedicated VLAN or network segment so only your devices can reach it. Most managed switches and many consumer routers support VLAN configuration.
- Firewall rules: if VLAN isolation is not available, configure the router or switch to restrict access to the Pi’s IP address to specific client devices.
- Dedicated network: for permanent installations, a small dedicated switch or router (connected to the PoE injector) keeps the Pi off the shared network entirely.
If isolation is not possible, do not assume Tailscale or a dashboard setting will hide the web UI from the local network. In the current build, the reliable controls are network-level ones: VLANs, firewall rules, or a dedicated network.
Public internet #
Do not expose this service to the public internet. The dashboard has no user authentication and is served over plain HTTP on the local hostname, so it is not built for a public-facing deployment. Use a private access path such as Tailscale if you need remote administration.
Updating the software #
velocity.report does not auto-update itself. Updates happen when you decide. When you run velocity device check or velocity device upgrade, the device contacts the release feed and downloads the selected release.
# Check whether a newer version is available
sudo velocity device check

# Download and apply the latest release
sudo velocity device upgrade

# If something goes wrong, roll back to the previous version
sudo velocity device rollback
Updates download the new version into /opt/velocity-report/versions/<v>/, run any database migrations, then activate it with an atomic symlink swap. Your data and configuration are preserved. For air-gapped deployments:
sudo velocity device upgrade --binary /path/to/velocityThe former
velocity-ctlcommand has been removed; device management is now thevelocity device …namespace.
Backup and restore #
Back up before re-flashing. Your sensor data took weeks to collect; the software can be re-flashed in ten minutes.
Back up your data #
The database lives at /var/lib/velocity-report/sensor_data.db.
sudo velocity device backupThis creates a timestamped copy in /var/lib/velocity-report/backups/. If you are about to re-flash the SD card, copy the backup off the Pi first:
# From your laptop
scp pi@velocity.local:/var/lib/velocity-report/sensor_data.db \
  ~/sensor_data_backup_$(date +%Y%m%d).db
Re-flash and restore #
- Re-flash the SD card using Step 2
- Boot the Pi and verify the service runs (
velocity-status) - Stop the service:
velocity-stop - Copy the backup into place:
# From your laptop
scp ~/sensor_data_backup_20260326.db \
  pi@velocity.local:/tmp/sensor_data.db

# On the Pi
sudo cp /tmp/sensor_data.db /var/lib/velocity-report/sensor_data.db
sudo chown velocity:velocity /var/lib/velocity-report/sensor_data.db- Start the service: it detects the existing database and runs any pending migrations automatically.
velocity-startTroubleshooting #
| Problem | Fix |
|---|---|
| No sensor data | ls /dev/serial0 or ls /dev/velocity-radar to check the device |
| Service will not start | velocity-log to check logs |
| Dashboard will not load | velocity-status to verify the service |
| Garbled or CSV output | Connect via screen /dev/serial0 19200 and send OJ then A! |
| Permission denied | sudo usermod -a -G dialout $USER then log out and back in |
USB-serial adapters get a /dev/velocity-radar symlink automatically.
- Full sensor documentation: OmniPreSense Support
- More help: DEBUGGING.md or Discord
Maintenance #
- Check the enclosure monthly for condensation
- Clean the sensor window seasonally
- Run
sudo velocity device checkperiodically
Reference #
What the image includes #
| Component | Location | Purpose |
|---|---|---|
| velocity binary | /usr/local/bin/velocity |
Single multi-call binary (server + device management) |
| velocity-report alias | /usr/local/bin/velocity-report |
Compatibility symlink the systemd unit calls |
| Generated reports | /var/lib/velocity-report/reports/ |
PDF output directory |
| Systemd service | /etc/systemd/system/velocity-report.service |
Starts automatically on boot |
The Go server binds port 80 directly as the non-root velocity user (granted CAP_NET_BIND_SERVICE by the systemd unit), so there is no reverse proxy and no TLS layer to manage. HTTPS is an optional Tailscale add-on (see Remote access with Tailscale).
The image also pre-configures serial port settings, UART overlays, sensor initialisation (JSON mode, units, magnitude reporting), and the service user.
Commands #
| Command | Purpose |
|---|---|
velocity-status |
systemctl status velocity-report.service |
velocity-log |
journalctl -u velocity-report.service -f |
velocity-bounce |
sudo systemctl restart velocity-report.service |
velocity-stop |
sudo systemctl stop velocity-report.service |
velocity-start |
sudo systemctl start velocity-report.service |
velocity version |
Print the installed server version |
sudo velocity device check |
Check whether a newer release is available |
sudo velocity device upgrade |
Download and apply the latest release |
sudo velocity device rollback |
Restore the previous version |
sudo velocity device backup |
Create a timestamped snapshot of binary and database |
Links #
- GitHub repository: github.com/banshee-data/velocity.report
- OmniPreSense support: omnipresense.com/support
- Community Discord: discord.gg/XXh6jXVFkt
- DEBUGGING.md
- CONTRIBUTING.md