Open-source speed monitoring for neighbourhood streets.
Collect the evidence yourself. velocity.report turns a Raspberry Pi and a radar sensor into a local speed monitor. Download the Pi image, aim it at your street, and generate a PDF you can take to City Hall: no cameras, no licence plates, no cloud accounts.
Mount it on a window or fence and the radar measures passing vehicle speeds. No images. No identifying data.
Everything runs locally on a Pi. The SQLite database stays on the device. Re-aim it, let it run for days or weeks, and keep the data on hardware you control.
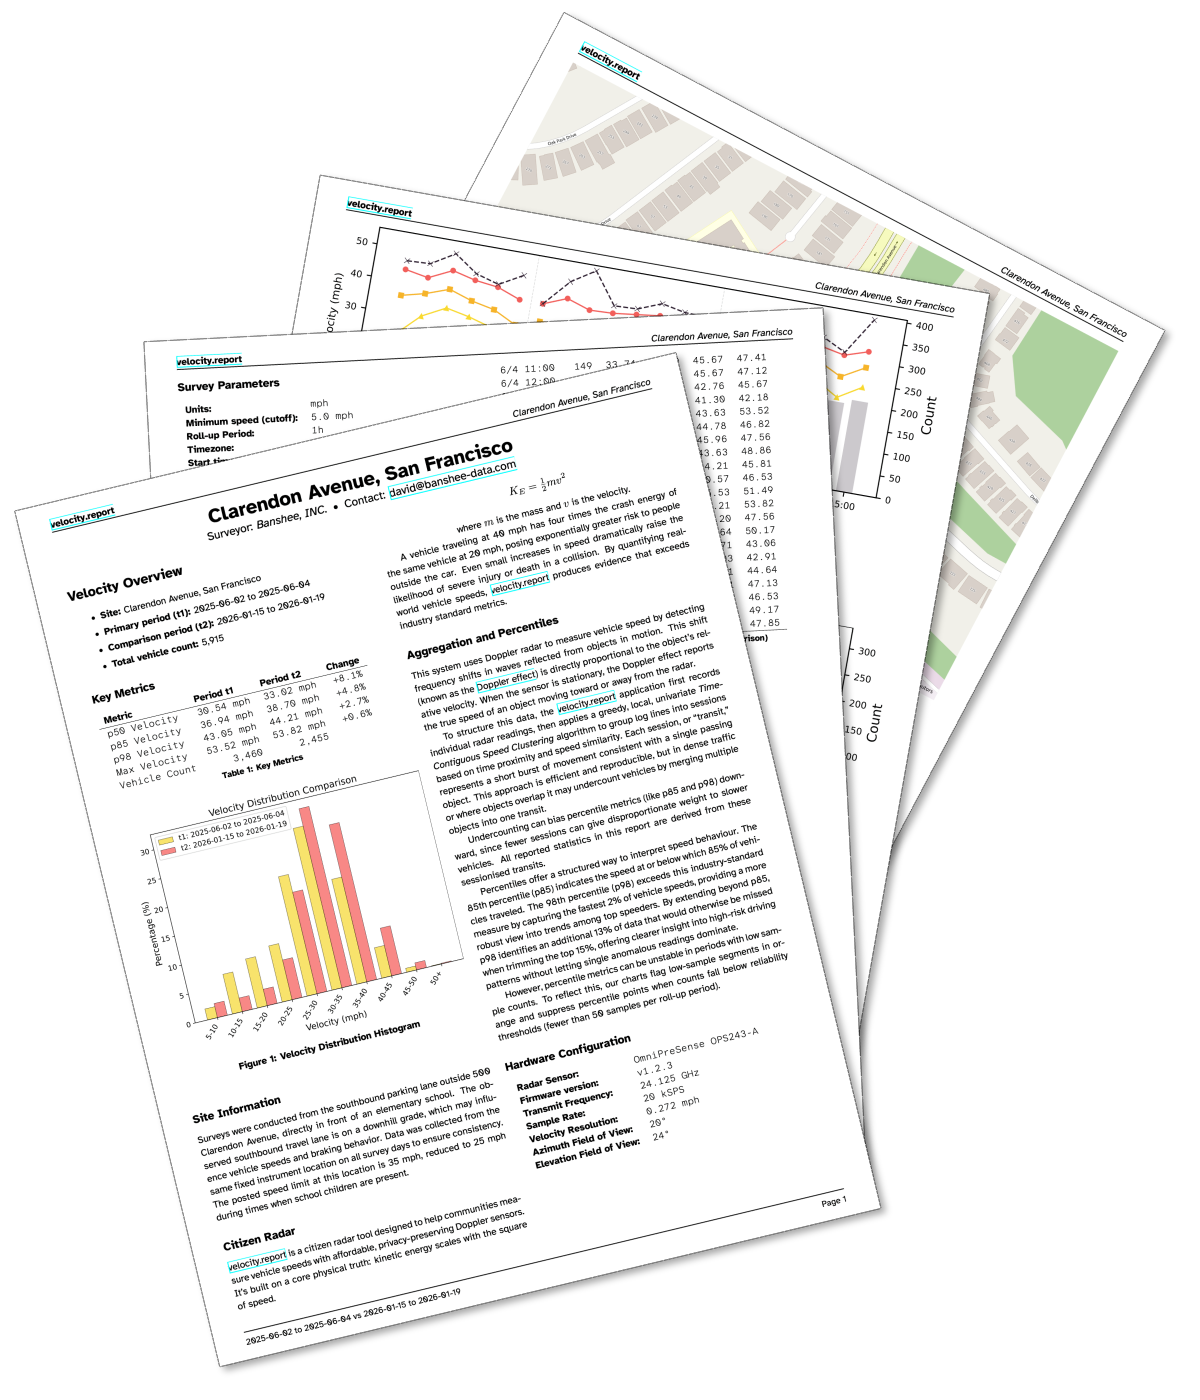
One click generates a council-ready PDF with speed distributions, percentiles, hourly patterns, and site information. It leaves less room for hand-waving and more room for the actual problem.
--repo flag should work everywhere. Only the path to the binary changes.
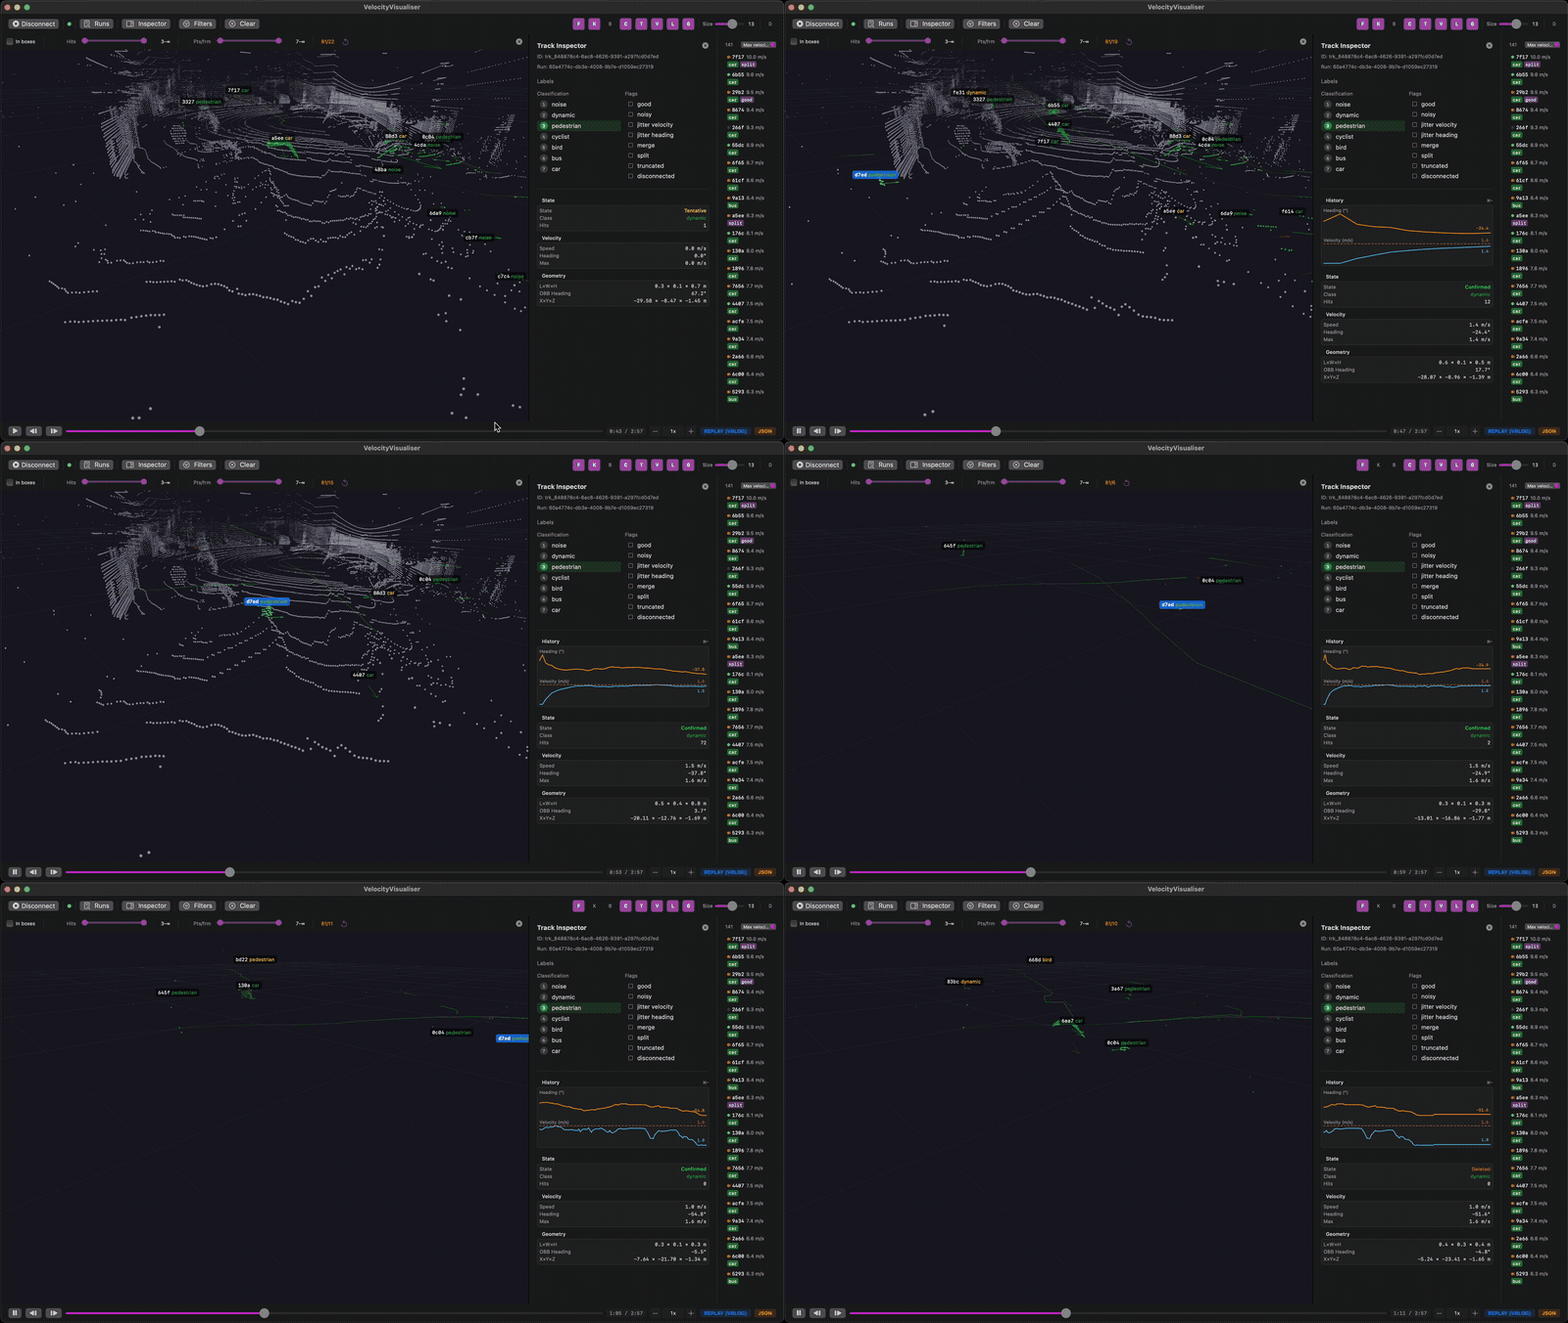
LiDAR measures where road users move through a street without taking camera images. The code is real, the maths are published, and the results are still being calibrated.
The radar setup gives you speed data and a PDF. LiDAR adds position, direction, and the space between road users. It does not yet give you a finished set of street-safety metrics to accept on sight. That is why the recordings and the unanswered questions are public.
One part of that future is the Traffic Description Language: a way to ask plain-English questions of the fused transit data. Questions like how closely drivers pass work crews, how much space cars leave cyclists in a bike lane, or how many cars come to a complete stop at an intersection when school gets out. In other words, the questions people actually ask once the speed chart has done its job.
You do not need to be a developer. Flash the Pi image, aim it out of a window, leave it running for a week, and take numbers to the next meeting instead of a story that someone can wave away.
The radar pipeline is the most mature part of the project. The LiDAR pipeline is open and still calibrating. Geometry, tracking, and classification still have real unanswered questions, which is another way of saying there is useful work to do.
Quick answers to the questions people usually ask before they download.
An open-source traffic speed monitor. Plug a radar sensor into a Raspberry Pi, let it measure how fast vehicles pass, and it produces a PDF with speed distributions, hourly patterns, and percentile breakdowns. No cloud, no cameras, and no habit of collecting things it does not need.
People trying to show that traffic on their street is a safety problem, and to do it with numbers rather than a weary look at the road. Residents, parent groups, neighbourhood campaigns, and anyone who has been told to come back with evidence.
Vehicle speeds. A radar sensor records how fast vehicles pass and stores the results on a Raspberry Pi. No faces, no licence plates, and no images of any kind.
Nowhere special. It stays on your device in a local database. There is no cloud account, no silent upload, and no side business in learning things about your street. Data leaves only when you decide to share the finished PDF.
LiDAR is still research-stage. The pipeline, maths, and public street scenes are open, and the current release includes a macOS visualiser for engineers and curious users. Today, the dependable PDF path is radar. LiDAR still expects an engineer in the room.
Follow the setup guide. You need a Raspberry Pi and an OmniPreSense radar sensor. By the end, you should have a working speed monitor and a PDF report fit for a council meeting.
"The goal is fewer crashes, fewer injuries, and zero fatalities.
If the speeds don't drop, the work can't stop."